To create an economy that consumes less carbon in the future, farmers can contribute a lot to this. This is especially true in Alberta since it has the boreal forest and grasslands, which are 2 crucial carbon sinks. Moreover, this is where ⅓ of Canada’s agricultural land is. You can also find here some of the greatest solar and wind energy resources.
Many people see solutions to climate issues as a burden in their daily lives. However, farming is one of these solutions. Besides resolving climate issues, farming also offers a lot of benefits such as better soil fertility, more economic opportunities, better management of ...
-
 Uncategorized
How Union County’s Food Hub Model Could Solve Your Community’s Food Access Gaps
The Union County Food Hub operates as a dual-purpose community…
-
 Uncategorized
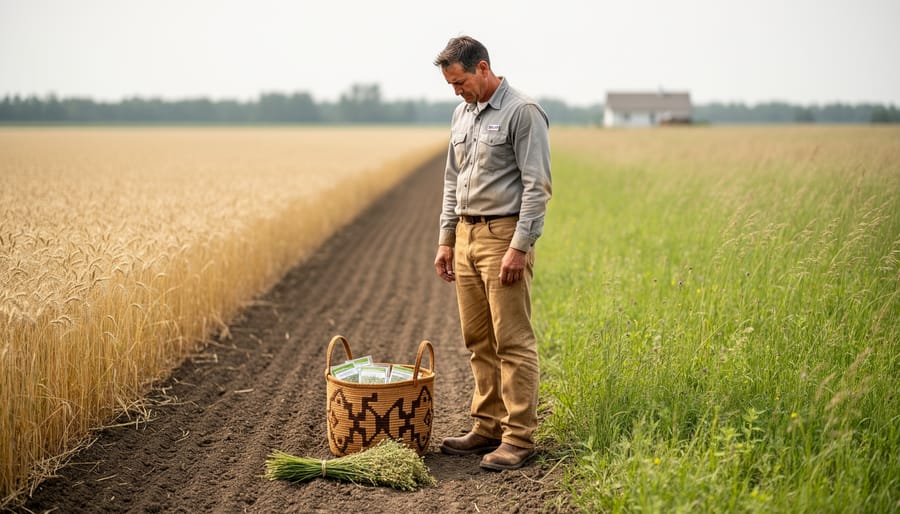
What Is Indigenous Knowledge in Climate Change Adaptation (and How Does It Work in Agriculture)?
Indigenous knowledge refers to the time-tested environmental practices, seasonal observations,…
-
 Climate Adaptation and Resilience Soil-Water Management Water Management and Conservation
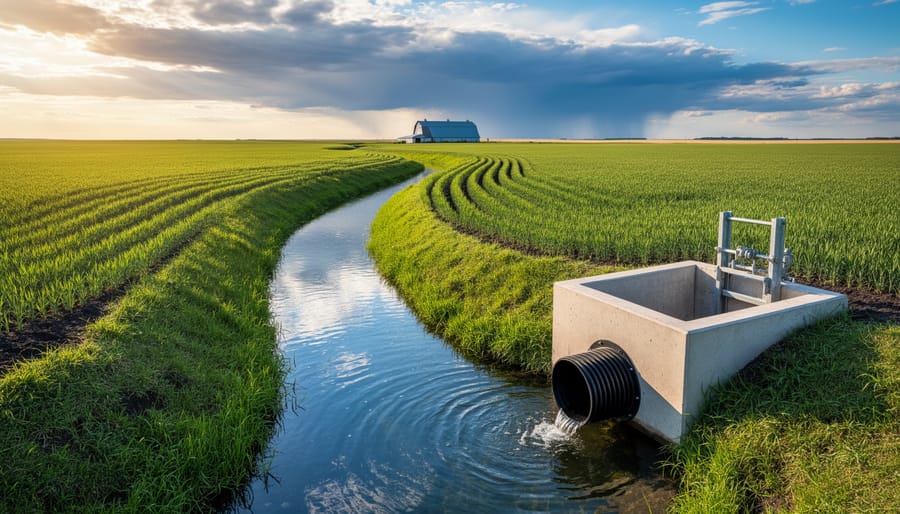
How Modern Drainage Technology Protects Your Fields from Flooding Damage
Install subsurface drainage systems with perforated pipes buried 0.9 to…
-
 Education and Knowledge Sharing
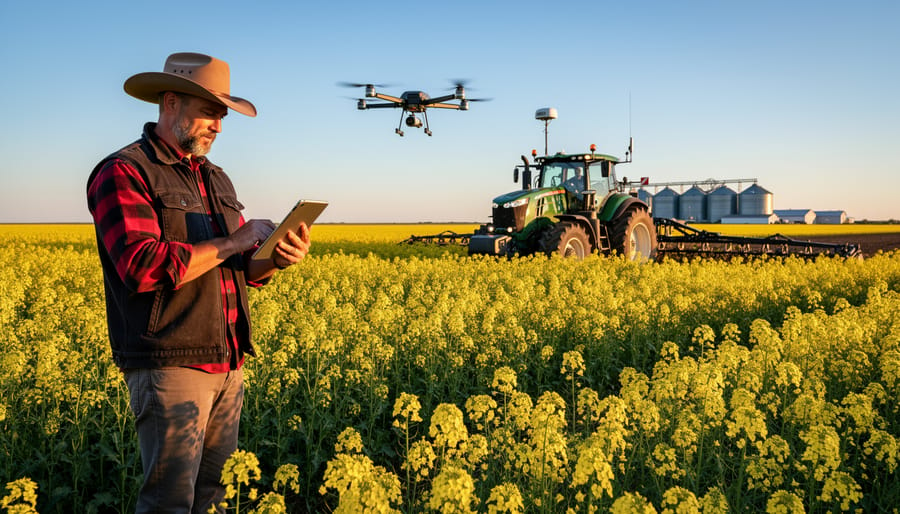
AI and Agriculture: How Smart Technology Is Transforming Farm Learning in Canada
Artificial intelligence is reshaping how Canadian farmers plant, monitor, and…